Dashboard
The dashboard is the first page after you sign in. It summarises every finding you are allowed to see and is the quickest way to find out how exposed the systems are.
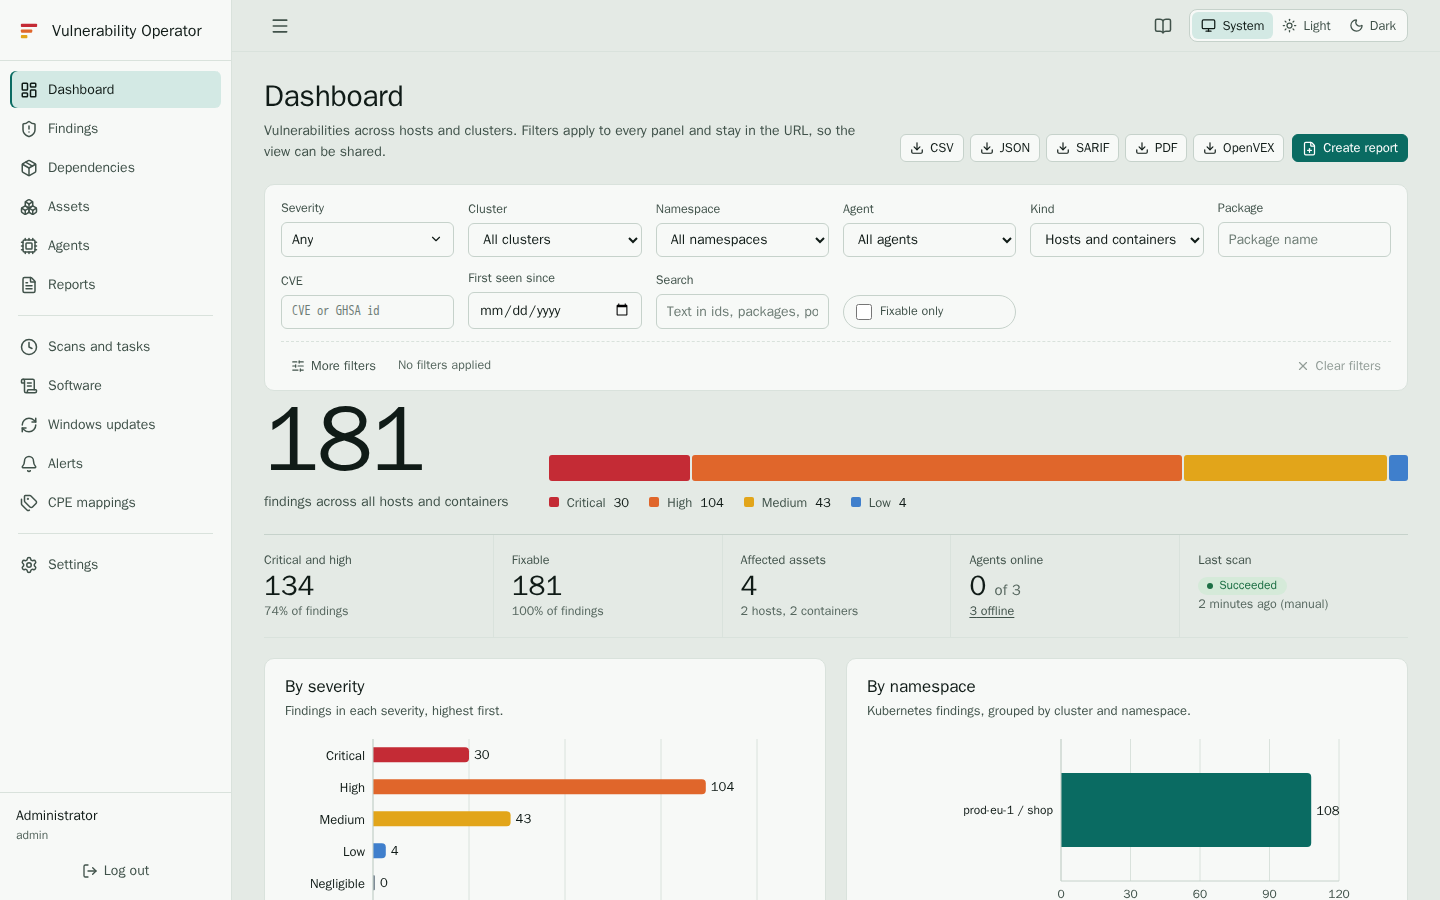
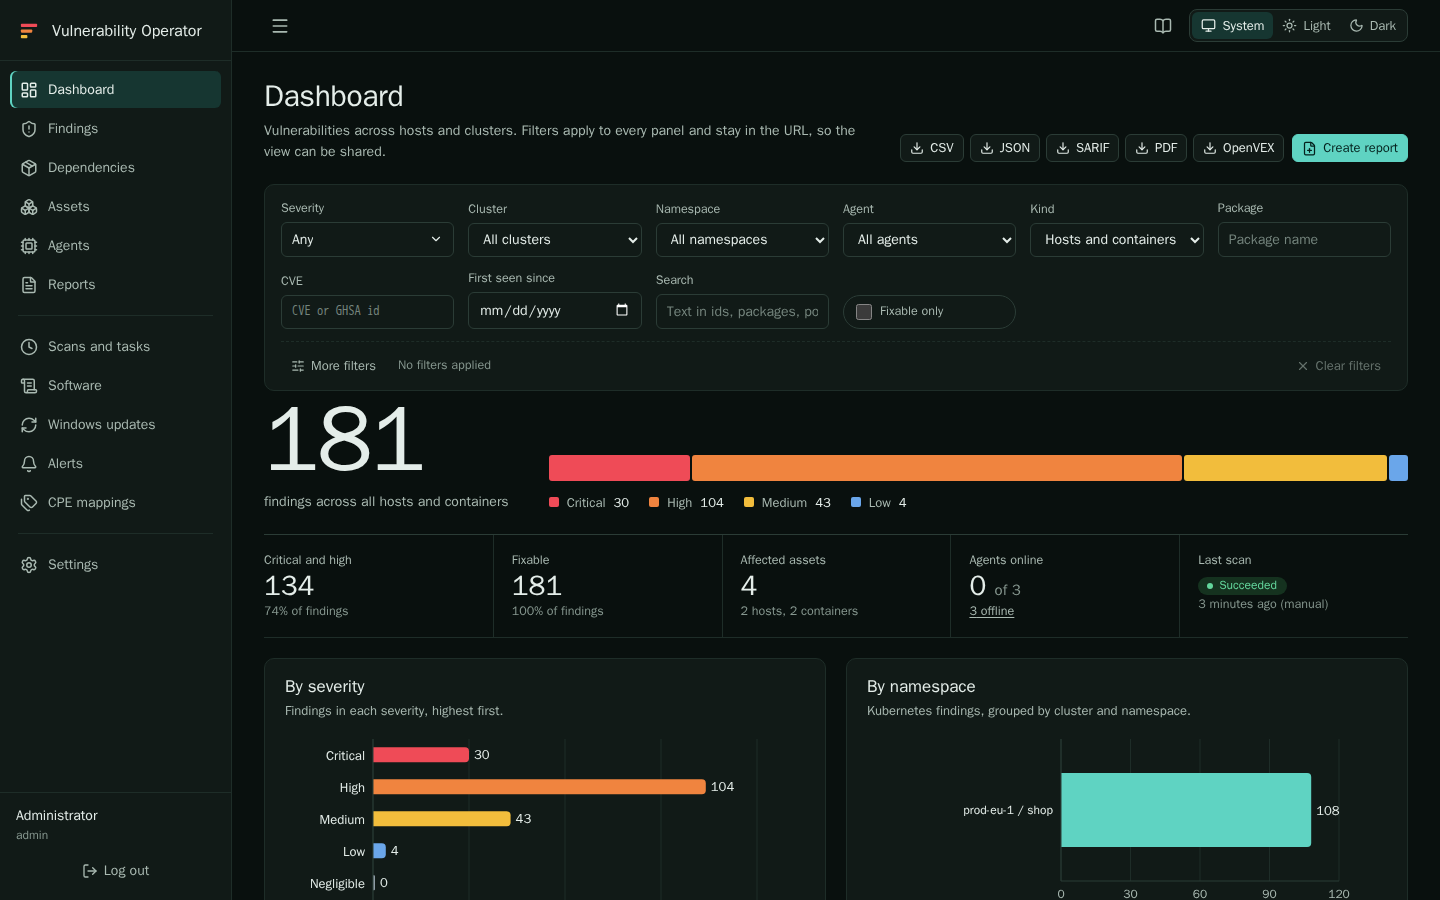
Summary
The top of the page shows the total number of findings, split into severities. Below it, five figures give the state of the estate:
- Critical and high: the number of findings at the two highest severities, and their share of all findings.
- Fixable: how many findings have a fixed version. Start here: each one is solved by an upgrade.
- Affected assets: how many hosts and containers have at least one finding.
- Agents online: how many agents reported recently, out of all agents. The number of offline agents is a link to the Agents page; an offline agent's inventory may be out of date.
- Last scan: the result and the time of the last scan, and how it was started (scheduled, manual or after an inventory).
If Last scan is old, the numbers may not include recent changes. Administrators can start a scan from the Start a scan link, see Scans and tasks.
Filters
The filter bar applies to every panel on the page. Filters are kept in the address of the page, so a filtered view can be shared as a link. The main filters are Severity, Cluster, Namespace, Agent, Kind, Package, CVE, First seen since, free Search text and Fixable only. Select More filters for asset, pod, container, image, package type, minimum CVSS, host name, operating system and package version. Clear filters resets all of them.
Panels
- By severity counts the findings at each level.
- By namespace groups the findings by cluster and namespace, which shows which workloads carry the most risk.
- New findings shows how many findings were first seen on each of the last 30 days, stacked by severity. It counts new findings only: a finding that was fixed is gone and does not show in the past days of an "open findings" count.
- Top vulnerabilities lists the vulnerabilities with the most findings, with their severity and whether they are fixable.
- Top packages lists the packages with the most findings. Select a package name to open the Findings page filtered to that package.
Export and reports
The buttons at the top right export the current view:
- CSV and JSON download the findings, with the filters applied.
- PDF downloads the same view as a PDF document.
- Create report opens the new-report form with the current filters filled in. The report can be generated again later. See Reports.
Exports are limited to the number of rows the administrator set, 10,000 by default. If an export is shorter than you expect, narrow the filters.