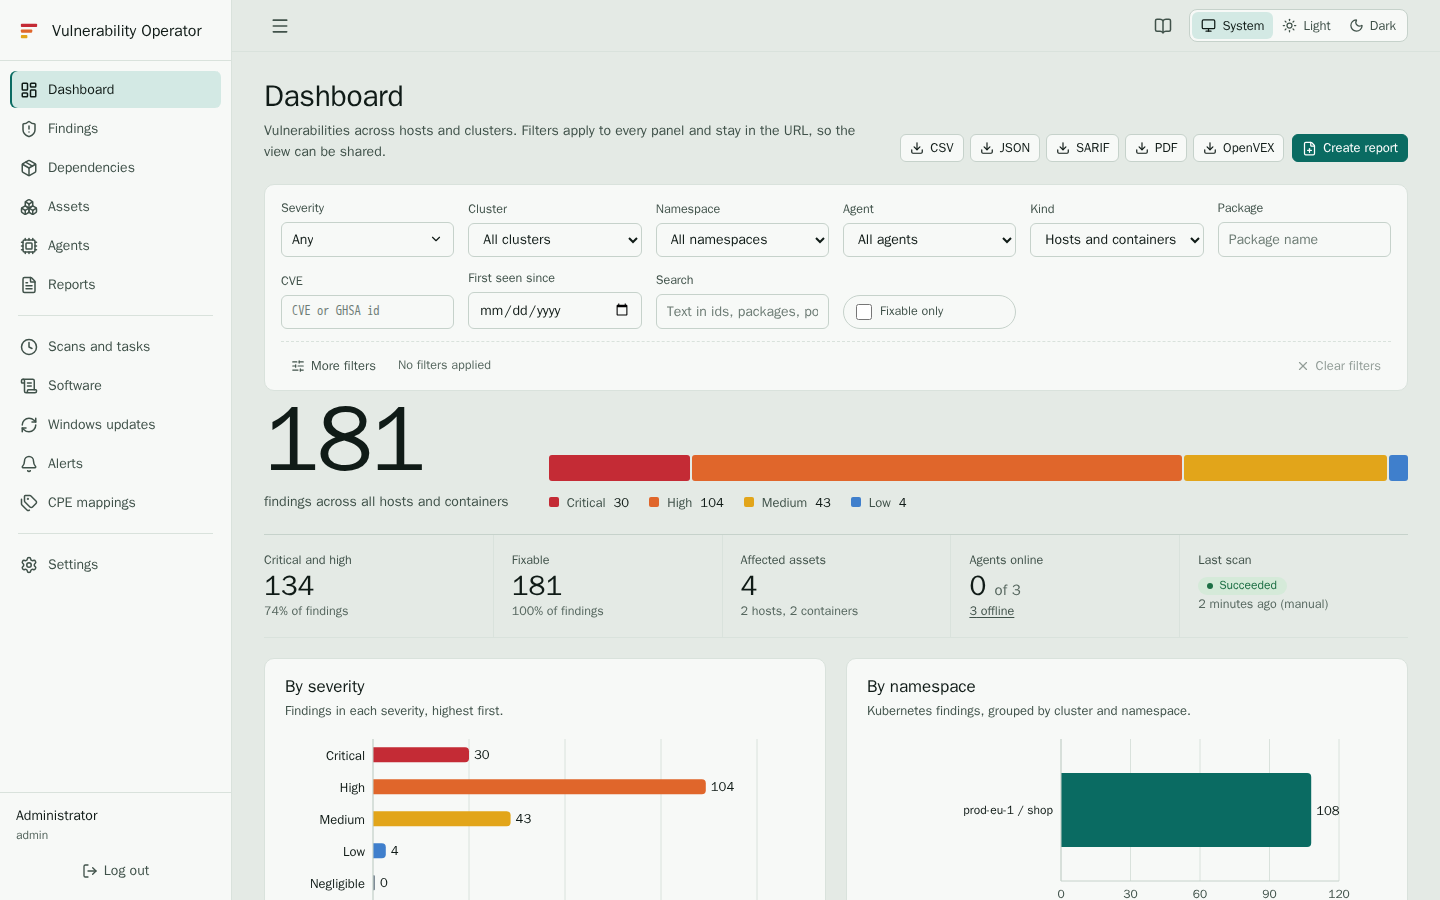
Vulnerability Operator
Vulnerability Operator collects the software inventory of your hosts and Kubernetes clusters, matches every package against vulnerability data, and shows where each vulnerability lives: the host, the cluster, the namespace, the pod and the container.
It has three parts:
- Agents run on each host or node. A Linux, Windows or macOS agent reads the installed packages of its machine. A Kubernetes agent scans the images of the pods on its node. Agents send their inventory to the server over HTTPS and never receive commands beyond updates.
- The server stores the inventories, runs the vulnerability scans with Grype against a local copy of its database, and serves the web interface, the REST API and an MCP endpoint for AI assistants.
- The web interface shows the dashboard, the findings, the dependencies and the assets, and lets authorised people create reports, alerts and settings.
Who this manual is for
| If you ... | Read |
|---|---|
| look at vulnerabilities, check what is affected, or export a report | the User guide |
| install, configure, connect agents, manage users and keep the system running | the Administrator guide |
| integrate with the REST API, the MCP endpoint, or need a list of permissions and settings | the Reference |
Most of the interface is governed by permissions. A user sees only the pages their roles allow, and only the clusters and nodes in their scope. If a page or a button is missing for you, ask an administrator; the permissions list shows what each one grants.
What you can do
- Find every vulnerable package on every host and container, filtered by severity, CVSS, cluster, namespace, agent, package or CVE.
- See which vulnerabilities have a fixed version, and which fixed version to use.
- Browse the dependencies of the inventory and follow a package to every asset it is installed on.
- Export findings and dependencies as CSV, JSON or PDF, and create PDF reports that keep the filters of the dashboard.
- Receive alerts for new findings and for agents that go offline, by ntfy, Gotify or e-mail.
- Let AI assistants query the inventory through the MCP endpoint, with a personal token.
How to read the screenshots
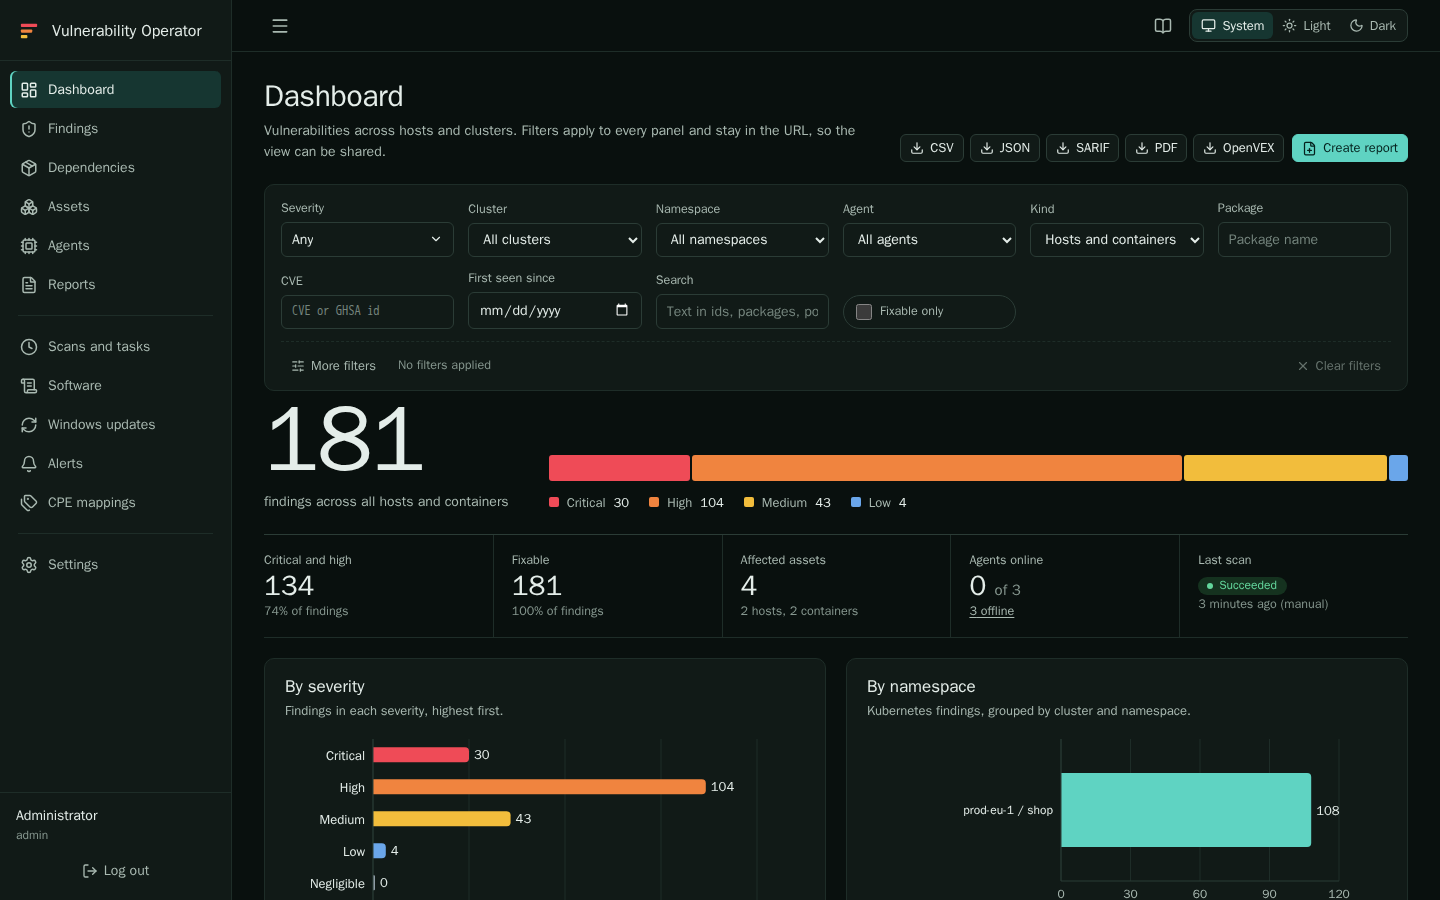
The screenshots in this manual are not drawn by hand. They are captured by the
build of the documentation from a running server that is filled with demo data
(two clusters, three agents, a viewer account and several hundred findings). Each
change to the code or to these pages produces new images. The demo names, such
as prod-eu-1, web-01 and checkout, are examples; your data will differ.
See About this manual for how the build works.